Equations
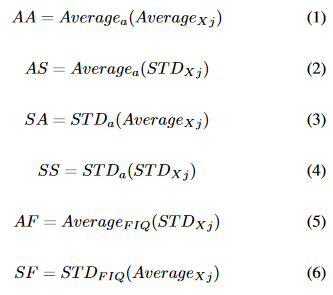
The raw sample on the Neuro-VisAge comprises the tuple average and standard deviation of each ROI of each subject. We grouped the values of each age. Therefore, Neuro-VisAge shows two averages (Equations 1 and 2) and two standard deviations (Equations 3 and 4).

For all equations, a represents a set of subjects of the same age, ranging from six to 56, and Xj represents all values of an ROI from a subject; therefore, the AA from Equation 1 represents the average for age a of the functional activity average of all subjects of age a for the ROI j. Equation 2 represents the average for age a of the functional activity standard deviation of all subjects of age a for the ROI j. Equation 3 represents the standard deviation for age a of the functional activity average of all subjects of age a for the ROI j. Equation 4 represents the standard deviation for age a of the functional activity standard deviation of all subjects of age a for the ROI j. Finally, Equations 5 and 6 represent the average and standard deviation analog from the other, but they group the subjects by FIQ instead of age.
